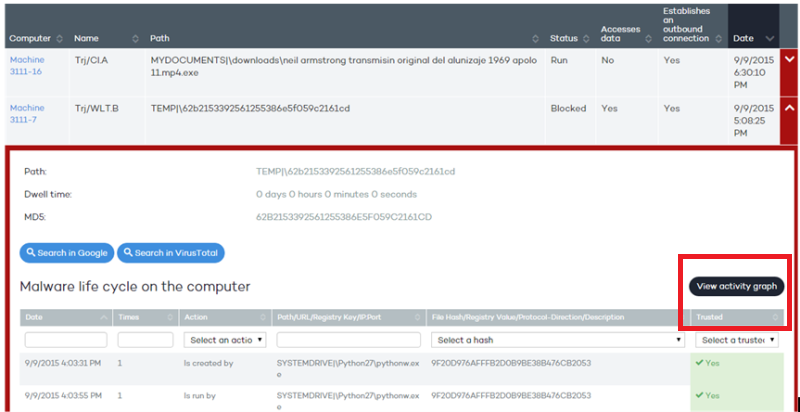
The Status window lets you access lists of the threats detected on the network by clicking the panels available in the Activity section. Click any of the threats to obtain a table with detailed information about their activity.
Clic the arrow:

Select the View activity graph button:

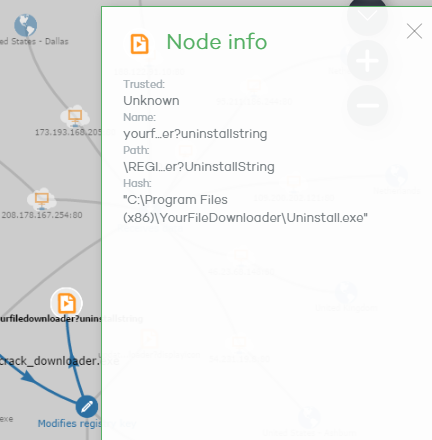
Execution graphs visually display the information shown in the action tables, emphasizing the temporal aspect.
The graphs are initially used to provide, at a glance, a general idea of the actions triggered by the threat.

The string of actions in the execution graph view is represented by two items:
Nodes: They mostly represent actions or information items
Lines and arrows: They unite the action and information nodes to establish a temporal order and assign each node the role of “subject” or “predicate”.