Security dashboard lists
The security lists contain the data used to generate the widgets. They show detailed information about the security of the computers on the network.
Accessing the clients’ security dashboard
-
From the top menu, select Status. Select Security
 .
. -
From the top menu, select Clients. Select Configure clients’ products. A page opens in a new browser tab.
-
On the new tab, select Status from the top menu. These lists appear:
-
Clients’ protection status: Shows the threats detected by the different protection modules for each of your clients. It also shows whether or not these modules are updated.
-
Risks: Shows the number of risks by computer for each of your clients. See chapter Risk assessment in the product administration guide.
-
Indicators of attack (IOA): Shows a summary of the indicators of attack found for each of your clients. An IOA is a sequence of unusual actions found in the events generated on a client’s computers and which are highly likely to be an attack. These attacks are typically at an early or exploitation stage and often do not use malware. Adversaries normally leverage the operating system own tools to execute their attacks and thereby hide the traces of their activity.
-
Patch installation results: Shows the results of installing program and operating system updates on the computers you manage.
-
Endpoint Access Enforcement: Shows information about inbound connections to computers on your clients’ networks, which meet the conditions configured in the Endpoint Access Enforcement feature. See chapter Endpoint Access Enforcement in the product administration guide.
-
Clients’ users: Provides overall information about users who log in to the management consoles of the clients you manage. It indicates which user logged in to the console and when, whether the login password was changed, and whether two-factor authentication (2FA) was required to log in to the console.
-
Monitoring and access based on the permissions assigned to the user account
For more information about user accounts and permissions, see chapter Access and authorization in Partner Center.
The Status page shows only clients visible to the user account used to log in to the console. This visibility is defined when you configure the permissions assigned to the user account. See Access and authorization in Partner Center.
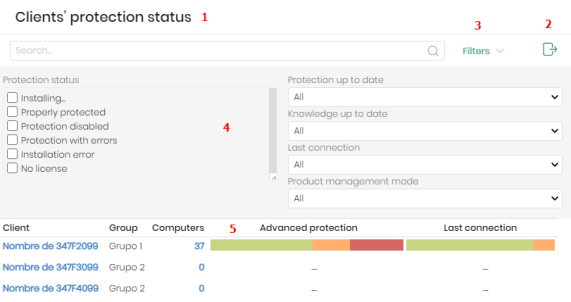
Sections of a list
All lists have a number of tools in common to make interpretation easier. This section describes the main elements in a sample list.
-
List name (1): Identifies the information in the list.
-
Export (2): Generates an Excel file with the content of the list.
-
Filter and search tools (3): Click the button to open a panel with the available filter tools. After you configure them, click the Filter (6) button.
-
Filter and search parameters (4): Enable you to filter the data in the list.
-
Sorting order (5): Click a column header to sort the list by that column. Click the same header a second time to switch between ascending and descending order. This is indicated with arrows (a
arrow or a
arrow). If you are accessing the management console from a small-size mobile device, click the
icon in the bottom-right corner of a list to show a menu with the names of the columns included in the table.
-
Pagination: Pagination controls appear at the bottom of the list to help you quickly move from page to page.
| Icon | Description |
|---|---|
|
|
Rows per page selector. |
|
|
Number of rows shown out of the total number of rows. |
|
|
First page link. |
|
|
Previous page link. |
|
|
Numbered links to access pages directly. |
|
|
Next page link. |
|
|
Last page link. |