lets you generate reports about the security status of your network and any detections made over a given period of time. You can also select the content that appears in the report, whether you want more detailed information and if you want graphs. All of these options are quick and simple to manage.
In the main window of the Web console, click Reports. The Reports window will open, which is divided into two sections: The first one lets you select the content and scope of the report, and the second one lets you schedule report sending tasks.
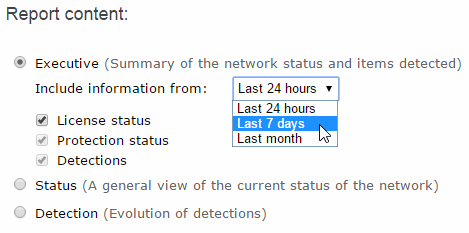
First, select the type of report that you want to generate.
In the Period menu, select the period you want to be covered in the report (last 24 hours, last 7 days or last month).
You can select different types of information depending on the type of report.

In the tree below Report scope, select the group or groups to be included in the report.
Select the All checkbox to select all existing groups.
If you don't need to schedule a report sending task but want to see the report immediately, click Generate report. The report will be immediately generated, and will appear on the report list in the left-hand side of the window.
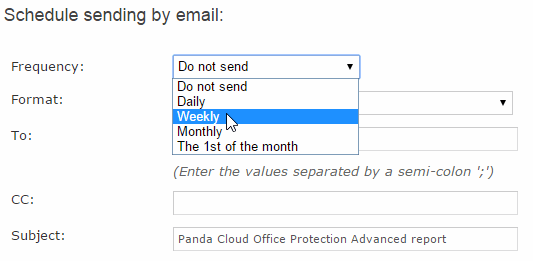
You can schedule tasks to send reports by email to selected recipients and in different formats.
The frequency options to schedule reports are as follows: monthly, weekly, daily and the 1st of the month.

You can schedule up to 27 sending tasks. If you reach that limit, you will need to delete a previous task to create a new one.
To be able to schedule report sending tasks you must have the appropriate permission. Please refer to the Types of permissions section in this Help file.
The number of non-scheduled reports that you can save is limitless. To access a report, simply click its name on the list that appears on the left side of the Reports window.
Click Save when you have finished creating and configuring a report. The report will appear on the report list on the left side of the window, and will be sent on the established date.